Last updated: 2025/12/11
多くの解析にはFALMAの波形とFALMAやDALMAの標定結果と合わせて解析する必要があります。標定結果の中の時刻はそれぞれの放電の発生時刻です。一方で、FALMAの波形の時刻はそれぞれのサイトがある放電を記録した時刻です。この2種類のデータを処理するときその時刻の差を考慮する必要があります。以下、この2種類のデータを使って、いくつかの種類の図の作成コードを紹介します。
以下のコードがSSHサーバ2に実行されることを前提とします。自分のパソコンに実行する場合は、必要なデータを事前にダウンロードするか、サーバからデータをダウンロードするコードを加える必要があります。
1. ある標定結果に対応する全サイトの波形のプロット
例えば、以下のFALMA標定結果は帰還雷撃を示します。この帰還雷撃の全サイトの波形をプロットします。
789.1605, 36.72574, 136.70347, 25.1, 7, 43, 68, 160, 99,1101001011100
(FALMA2D_1736234029.dat)
以下のような図を作成します。各サイトの波形を距離順に並べ、左のdの値で距離を示し、右にサイト名も示します。X軸の時間は放電の発生時間に統一します。標定結果によると、この放電の発生時刻は789.1605msで、X軸の値と一致します。

以下はこの図を作成するコードです。設定する箇所:
行9:10桁のunix time
行10:FALMA標定結果
行11:図の保存場所
行14,15:プロットする波形の長さ(前半と後半)
#DALMA標定結果を使う場合は、行19-22をいじる必要があります。
#1秒の最初と最後の放電をプロットするとき、エラーになることがあります。
 #!/usr/bin/env python3

import os
import bz2
import numpy as np
import matplotlib.pyplot as plt
import datetime

strTime = '1736234029'
strLoc = ' 	 789.1605, 36.72574, 136.70347,  25.1, 7, 43, 68,  160, 99,1101001011100'
picDir = '/home/username/'

#プロットする波形の長さを指定する(us)
halfLenBef = 500 #放電の前の波形の長さ
halfLenAft = 500 #放電の後の波形の長さ

#標定結果から時刻、緯度経度を取得
#DALMA標定結果の場合はまずX,Yを緯度経度に変換する
strLocInfoMat = strLoc.split(',')
t0 = float(strLocInfoMat[0])
lati0 = float(strLocInfoMat[1])
longi0 = float(strLocInfoMat[2])


cAllSite = [       'AKK',     'FTK',     'GFU',    'HIM',    'HKI',      'IBG',    'IMZ',      'KCC',      'KGM',      'KRB',      'KSM',     'KTJ',    'KZK',      'MIN',      'NAT',      'NNO',     'NZN',      'SKI',     'SKY',     'SSK',     'SUM',      'TBT',     'TKO',     'TYM',     'TGU']
cAllLati = [    36.42482,  37.14248, 35.464567, 36.85695, 36.89355,   35.63635, 36.73055,  34.678933,    36.5178,  36.871667,  35.715483, 36.778017, 36.60805,  36.666517,  36.552833,   37.04315, 36.954400,  36.166958, 36.685283,  36.44767, 36.665283,  36.669217, 36.707583, 36.752083, 35.705328]
cAllLongi =[   136.42265, 136.69226,136.738367,  136.973, 136.7791, 136.484567, 137.0756, 135.067467, 136.742883, 137.447500,   137.3707,137.123367,  136.594, 136.665233, 136.954983, 136.966983,137.498167, 136.231567,136.694300, 136.64967, 136.64515, 136.728717,  136.9237,137.297100,139.490561]

#--------------------FALMA波形データの保存場所を特定する関数----------
dirFile = '/media/lightning/HDD0/list/FALMA_dirlist.txt'
endDateMat = []
diskMat = []
fid = open(dirFile)
while True:
    strLine = fid.readline()
    if len(strLine)<2:
        break
    endDateMat.append(strLine[0:8])
    diskMat.append(strLine[9:-1])
fid.close()

def getDisk(strDate):
    count = sum(1 for d in endDateMat if d < strDate)
    return diskMat[count]
#----------------------------------------------------------------------

#-----------------------緯度経度から距離を計算する関数----------------
R = 6370.519
def dis(lati1, longi1, lati2, longi2):
    lati1 = lati1/180*np.pi
    longi1 = longi1/180*np.pi
    lati2 = lati2/180*np.pi
    longi2 = longi2/180*np.pi
    return R*np.arccos(np.sin(lati1)*np.sin(lati2)+np.cos(lati1)*np.cos(lati2)*np.cos(longi1-longi2))
#---------------------------------------------------------------------

strNatTime = datetime.datetime.fromtimestamp(float(strTime)).strftime('%Y%m%d-%H%M%S')
strDate = strNatTime[0:8]
strDisk = getDisk(strDate)
dataRoot = '/media/lightning/'+strDisk+strDate+'/'

plotSiteMat = []
dataMatList = []
siteDisMat = []
siteMat = os.listdir(dataRoot)
siteMat.sort()
for siteName in siteMat:
    if siteName not in cAllSite:
        continue
    dataFile = siteName+'L'+strTime+'.bz2'
    if os.path.exists(dataRoot+siteName+'/'+dataFile)==False:
        continue

    siteIndex = cAllSite.index(siteName)
    siteLati = cAllLati[siteIndex]
    siteLongi = cAllLongi[siteIndex]
    siteDis = dis(siteLati, siteLongi, lati0, longi0)
    #距離を考慮して波形の対応の部分を特定する
    pDiffer = int(round(siteDis*10/3))
    centerIndex = int(round(t0*1000+pDiffer))
    begIndex = centerIndex-halfLenBef
    endIndex = centerIndex+halfLenAft

    fidFile = bz2.BZ2File(dataRoot+siteName+'/'+dataFile)
    dataMat = np.frombuffer(fidFile.read(), np.int16)
    fidFile.close()

    dataMatList.append(dataMat[begIndex:endIndex])
    plotSiteMat.append(siteName)
    siteDisMat.append(siteDis)
plotSiteNum = len(plotSiteMat)

#距離順に並ぶ
sortIndexMat = np.argsort(siteDisMat)

#Make figure
f = plt.figure(figsize=(16,12))
belowMargin = 0.06
aboveMargin = 0.02
height = (1-belowMargin-aboveMargin)/plotSiteNum
width = 0.9
leftMargin = 0.06
rightMargin = 1-width-leftMargin

axMat = list(range(plotSiteNum))
for i in range(plotSiteNum):
    axMat[i] = f.add_axes([leftMargin, belowMargin+height*(plotSiteNum-1-i), width, height])
    if i<plotSiteNum-1:
        plt.setp(axMat[i].get_xticklabels(), visible=False)

#時間の行列(放電の発生時刻を基準にする)
tMat = np.linspace(t0-halfLenBef/1000, t0+halfLenAft/1000, halfLenBef+halfLenAft)

for i in range(plotSiteNum):
    indexVal = sortIndexMat[i]
    siteName = plotSiteMat[indexVal]
    dataMat = dataMatList[indexVal]
    siteDis = siteDisMat[indexVal]
    axMat[i].plot(tMat, dataMat)
    axMat[i].text(0.98, 0.98, siteName, horizontalalignment='right', verticalalignment='top', transform = axMat[i].transAxes)
    axMat[i].text(0.02, 0.98, 'd=%5.1f km' % siteDis, horizontalalignment='left', verticalalignment='top', transform = axMat[i].transAxes)
    axMat[i].set_xlim([tMat[0], tMat[-1]])

axMat[plotSiteNum//2].set_ylabel('E change (Digital Unit)')
axMat[-1].set_xlabel('Time (ms, after '+strNatTime+' JST)')

plt.savefig(picDir+'FALMA_'+strTime+'.png', dpi=100)
#!/usr/bin/env python3
import os
import bz2
import numpy as np
import matplotlib.pyplot as plt
import datetime
strTime = '1736234029'
strLoc = ' 789.1605, 36.72574, 136.70347, 25.1, 7, 43, 68, 160, 99,1101001011100'
picDir = '/home/username/'
#プロットする波形の長さを指定する(us)
halfLenBef = 500 #放電の前の波形の長さ
halfLenAft = 500 #放電の後の波形の長さ
#標定結果から時刻、緯度経度を取得
#DALMA標定結果の場合はまずX,Yを緯度経度に変換する
strLocInfoMat = strLoc.split(',')
t0 = float(strLocInfoMat[0])
lati0 = float(strLocInfoMat[1])
longi0 = float(strLocInfoMat[2])
cAllSite = [ 'AKK', 'FTK', 'GFU', 'HIM', 'HKI', 'IBG', 'IMZ', 'KCC', 'KGM', 'KRB', 'KSM', 'KTJ', 'KZK', 'MIN', 'NAT', 'NNO', 'NZN', 'SKI', 'SKY', 'SSK', 'SUM', 'TBT', 'TKO', 'TYM', 'TGU']
cAllLati = [ 36.42482, 37.14248, 35.464567, 36.85695, 36.89355, 35.63635, 36.73055, 34.678933, 36.5178, 36.871667, 35.715483, 36.778017, 36.60805, 36.666517, 36.552833, 37.04315, 36.954400, 36.166958, 36.685283, 36.44767, 36.665283, 36.669217, 36.707583, 36.752083, 35.705328]
cAllLongi =[ 136.42265, 136.69226,136.738367, 136.973, 136.7791, 136.484567, 137.0756, 135.067467, 136.742883, 137.447500, 137.3707,137.123367, 136.594, 136.665233, 136.954983, 136.966983,137.498167, 136.231567,136.694300, 136.64967, 136.64515, 136.728717, 136.9237,137.297100,139.490561]
#--------------------FALMA波形データの保存場所を特定する関数----------
dirFile = '/media/lightning/HDD0/list/FALMA_dirlist.txt'
endDateMat = []
diskMat = []
fid = open(dirFile)
while True:
strLine = fid.readline()
if len(strLine)<2:
break
endDateMat.append(strLine[0:8])
diskMat.append(strLine[9:-1])
fid.close()
def getDisk(strDate):
count = sum(1 for d in endDateMat if d < strDate)
return diskMat[count]
#----------------------------------------------------------------------
#-----------------------緯度経度から距離を計算する関数----------------
R = 6370.519
def dis(lati1, longi1, lati2, longi2):
lati1 = lati1/180*np.pi
longi1 = longi1/180*np.pi
lati2 = lati2/180*np.pi
longi2 = longi2/180*np.pi
return R*np.arccos(np.sin(lati1)*np.sin(lati2)+np.cos(lati1)*np.cos(lati2)*np.cos(longi1-longi2))
#---------------------------------------------------------------------
strNatTime = datetime.datetime.fromtimestamp(float(strTime)).strftime('%Y%m%d-%H%M%S')
strDate = strNatTime[0:8]
strDisk = getDisk(strDate)
dataRoot = '/media/lightning/'+strDisk+strDate+'/'
plotSiteMat = []
dataMatList = []
siteDisMat = []
siteMat = os.listdir(dataRoot)
siteMat.sort()
for siteName in siteMat:
if siteName not in cAllSite:
continue
dataFile = siteName+'L'+strTime+'.bz2'
if os.path.exists(dataRoot+siteName+'/'+dataFile)==False:
continue
siteIndex = cAllSite.index(siteName)
siteLati = cAllLati[siteIndex]
siteLongi = cAllLongi[siteIndex]
siteDis = dis(siteLati, siteLongi, lati0, longi0)
#距離を考慮して波形の対応の部分を特定する
pDiffer = int(round(siteDis*10/3))
centerIndex = int(round(t0*1000+pDiffer))
begIndex = centerIndex-halfLenBef
endIndex = centerIndex+halfLenAft
fidFile = bz2.BZ2File(dataRoot+siteName+'/'+dataFile)
dataMat = np.frombuffer(fidFile.read(), np.int16)
fidFile.close()
dataMatList.append(dataMat[begIndex:endIndex])
plotSiteMat.append(siteName)
siteDisMat.append(siteDis)
plotSiteNum = len(plotSiteMat)
#距離順に並ぶ
sortIndexMat = np.argsort(siteDisMat)
#Make figure
f = plt.figure(figsize=(16,12))
belowMargin = 0.06
aboveMargin = 0.02
height = (1-belowMargin-aboveMargin)/plotSiteNum
width = 0.9
leftMargin = 0.06
rightMargin = 1-width-leftMargin
axMat = list(range(plotSiteNum))
for i in range(plotSiteNum):
axMat[i] = f.add_axes([leftMargin, belowMargin+height*(plotSiteNum-1-i), width, height])
if i<plotSiteNum-1:
plt.setp(axMat[i].get_xticklabels(), visible=False)
#時間の行列(放電の発生時刻を基準にする)
tMat = np.linspace(t0-halfLenBef/1000, t0+halfLenAft/1000, halfLenBef+halfLenAft)
for i in range(plotSiteNum):
indexVal = sortIndexMat[i]
siteName = plotSiteMat[indexVal]
dataMat = dataMatList[indexVal]
siteDis = siteDisMat[indexVal]
axMat[i].plot(tMat, dataMat)
axMat[i].text(0.98, 0.98, siteName, horizontalalignment='right', verticalalignment='top', transform = axMat[i].transAxes)
axMat[i].text(0.02, 0.98, 'd=%5.1f km' % siteDis, horizontalalignment='left', verticalalignment='top', transform = axMat[i].transAxes)
axMat[i].set_xlim([tMat[0], tMat[-1]])
axMat[plotSiteNum//2].set_ylabel('E change (Digital Unit)')
axMat[-1].set_xlabel('Time (ms, after '+strNatTime+' JST)')
plt.savefig(picDir+'FALMA_'+strTime+'.png', dpi=100)行77,79に放電とそれぞれのサイトの距離と時間差(波形の点差)を計算し、その時間差を考慮して、行81,82に波形の開始と終了のindexを計算する。行112に共通の時間軸を作る。
2. DALMA標定結果とFALMA波形の対応関係を示す図
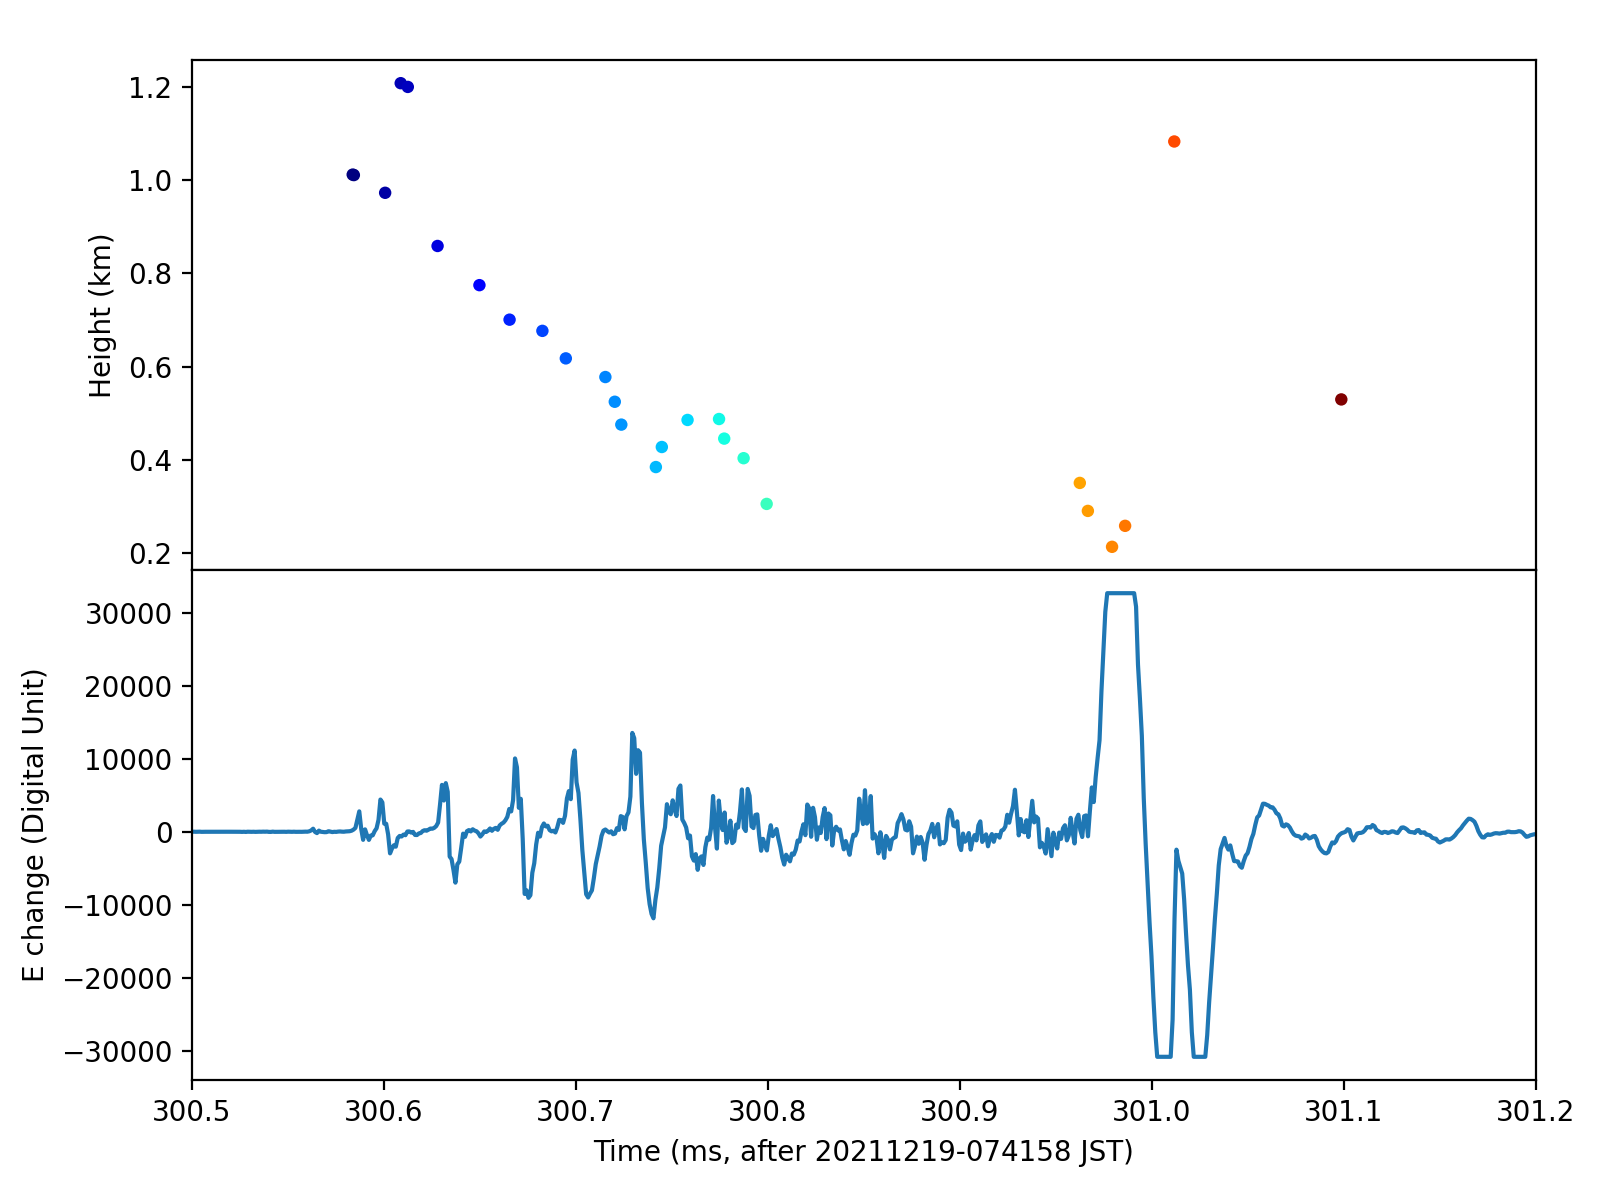
DALMAの標定結果とFALMAの波形がどう対応するかを調べるとき、DALMA標定結果の「高度ー時間」図とFALMAの波形図を一緒にプロットすればわかりやすいです。ここも2種類のデータの時間のズレに注意する必要があります。
例えば、1639867318のFALMA波形を確認すると、301ms頃にECSが発生したことが分かります。DALMAの標定結果を確認したら、確かに301ms頃に下向きのリーダが標定されました。
以下の図の上半分はDALMAの標定結果、下半分はFALMAの波形です。共通のX軸は放電の発生時刻(DALMA標定結果の時刻)に統一されます。
以下はこの図を作成するコードです。設定する箇所:
行8:10桁のunix time
行9:FALMAサイト
行10:図の保存場所
行13,14:プロットするDALMA標定結果の時間範囲(ms)
 #!/usr/bin/env python3

import bz2
import numpy as np
import matplotlib.pyplot as plt
import datetime

strTime = '1639867318'
siteName = 'AKK'
picDir = '/home/username/'

#プロットする標定結果の時間範囲を指定する(ms)
begTime = 300.5
endTime = 301.2

strNatTime = datetime.datetime.fromtimestamp(float(strTime)).strftime('%Y%m%d-%H%M%S')
strDate = strNatTime[0:8]

#----------------------FALMAサイトの緯度経度をX,Yに変換する------------------------
cAllSite = [       'AKK',     'FTK',     'GFU',    'HIM',    'HKI',      'IBG',    'IMZ',      'KCC',      'KGM',      'KRB',      'KSM',     'KTJ',    'KZK',      'MIN',      'NAT',      'NNO',     'NZN',      'SKI',     'SKY',     'SSK',     'SUM',      'TBT',     'TKO',     'TYM',     'TGU']
cAllLati = [    36.42482,  37.14248, 35.464567, 36.85695, 36.89355,   35.63635, 36.73055,  34.678933,    36.5178,  36.871667,  35.715483, 36.778017, 36.60805,  36.666517,  36.552833,   37.04315, 36.954400,  36.166958, 36.685283,  36.44767, 36.665283,  36.669217, 36.707583, 36.752083, 35.705328]
cAllLongi =[   136.42265, 136.69226,136.738367,  136.973, 136.7791, 136.484567, 137.0756, 135.067467, 136.742883, 137.447500,   137.3707,137.123367,  136.594, 136.665233, 136.954983, 136.966983,137.498167, 136.231567,136.694300, 136.64967, 136.64515, 136.728717,  136.9237,137.297100,139.490561]

R = 6370.519
flmLati = 36.76/180*np.pi #Latitude and longtitude of the center of FALMA
flmLongi = 136.76/180*np.pi

def convertLoc(longiVal, latiVal):
    longiVal = longiVal/180.0*np.pi
    latiVal = latiVal/180.0*np.pi
    x = np.arcsin(np.sin((longiVal-flmLongi)/2.0)*np.cos(flmLati))*R*2
    y = (latiVal-flmLati)*R
    return [x, y]

cAllX = []
cAllY = []
for i in range(len(cAllSite)):
    [x, y] = convertLoc(cAllLongi[i], cAllLati[i])
    cAllX.append(x)
    cAllY.append(y)
#------------------------------------------------------------------------------

#--------------------FALMA波形データの保存場所を特定する関数----------
dirFile = '/media/lightning/HDD0/list/FALMA_dirlist.txt'
endDateMat = []
diskMat = []
fid = open(dirFile)
while True:
    strLine = fid.readline()
    if len(strLine)<2:
        break
    endDateMat.append(strLine[0:8])
    diskMat.append(strLine[9:-1])
fid.close()

def getDisk(strDate):
    count = sum(1 for d in endDateMat if d < strDate)
    return diskMat[count]
#----------------------------------------------------------------------

#Read DALMA data
tMat = []
xMat = []
yMat = []
zMat = []
fidLoc = open('/media/lightning/HDD0/results/'+strDate[0:4]+'/3DLocRes/'+strDate+'/HF3D_'+strTime+'.dat')
fidLoc.readline()
while True:
    strLine = fidLoc.readline()
    if len(strLine)<2:
        break
    tVal = float(strLine[0:10])
    if tVal<begTime:
        continue
    elif tVal>endTime:
        break
    xVal = float(strLine[11:18])/1000
    yVal = float(strLine[19:26])/1000
    zVal = float(strLine[27:32])/1000
    tMat.append(tVal)
    xMat.append(xVal)
    yMat.append(yVal)
    zMat.append(zVal)
fidLoc.close()

#これらの放電と指定したサイトの距離を計算する
#同じ距離と仮定し、xMat,yMatの中央値を使って計算する
x0 = np.median(xMat)
y0 = np.median(yMat)
siteIndex = cAllSite.index(siteName)
siteX = cAllX[siteIndex]
siteY = cAllY[siteIndex]
siteDis = ((siteX-x0)**2+(siteY-y0)**2)**0.5
pDiffer = siteDis*10/3

#FALMA波形データを読み込む
strDisk = getDisk(strDate)
dataDir = '/media/lightning/'+strDisk+strDate+'/'+siteName+'/'
dataFile = siteName+'L'+strTime+'.bz2'
fidFile = bz2.BZ2File(dataDir+dataFile)
dataMat = np.frombuffer(fidFile.read(), np.int16)
fidFile.close()

begIndex = int(round(begTime*1000+pDiffer))
endIndex = int(round(endTime*1000+pDiffer))
waveTMat = np.linspace(begTime, endTime, endIndex-begIndex)

#Make figure
le = 0.12
re = 0.04
w = 1-le-re

te = 0.05
be = 0.1
h = (1-te-be)/2

f = plt.figure(figsize=(8, 6))
ax1 = f.add_axes([le, be+h, w, h])
ax2 = f.add_axes([le, be, w, h])
ax1.set_xticks([])

ax1.scatter(tMat, zMat, marker='o', c=tMat, s=20, edgecolor='none', cmap='jet')
ax2.plot(waveTMat, dataMat[begIndex:endIndex])
ax2.text(0.98, 0.98, siteName, horizontalalignment='right', verticalalignment='top', transform = ax2.transAxes)
ax2.text(0.02, 0.98, 'd=%5.1f km' % siteDis, horizontalalignment='left', verticalalignment='top', transform = ax2.transAxes)

ax1.set_ylabel('Height (km)')
ax2.set_xlabel('Time (ms, after '+strNatTime+' JST)')
ax2.set_ylabel('E change (Digital Unit)')
ax1.set_xlim([begTime, endTime])
ax2.set_xlim([begTime, endTime])

plt.savefig(picDir+strTime+'_'+siteName+'.png', dpi=200)
#!/usr/bin/env python3
import bz2
import numpy as np
import matplotlib.pyplot as plt
import datetime
strTime = '1639867318'
siteName = 'AKK'
picDir = '/home/username/'
#プロットする標定結果の時間範囲を指定する(ms)
begTime = 300.5
endTime = 301.2
strNatTime = datetime.datetime.fromtimestamp(float(strTime)).strftime('%Y%m%d-%H%M%S')
strDate = strNatTime[0:8]
#----------------------FALMAサイトの緯度経度をX,Yに変換する------------------------
cAllSite = [ 'AKK', 'FTK', 'GFU', 'HIM', 'HKI', 'IBG', 'IMZ', 'KCC', 'KGM', 'KRB', 'KSM', 'KTJ', 'KZK', 'MIN', 'NAT', 'NNO', 'NZN', 'SKI', 'SKY', 'SSK', 'SUM', 'TBT', 'TKO', 'TYM', 'TGU']
cAllLati = [ 36.42482, 37.14248, 35.464567, 36.85695, 36.89355, 35.63635, 36.73055, 34.678933, 36.5178, 36.871667, 35.715483, 36.778017, 36.60805, 36.666517, 36.552833, 37.04315, 36.954400, 36.166958, 36.685283, 36.44767, 36.665283, 36.669217, 36.707583, 36.752083, 35.705328]
cAllLongi =[ 136.42265, 136.69226,136.738367, 136.973, 136.7791, 136.484567, 137.0756, 135.067467, 136.742883, 137.447500, 137.3707,137.123367, 136.594, 136.665233, 136.954983, 136.966983,137.498167, 136.231567,136.694300, 136.64967, 136.64515, 136.728717, 136.9237,137.297100,139.490561]
R = 6370.519
flmLati = 36.76/180*np.pi #Latitude and longtitude of the center of FALMA
flmLongi = 136.76/180*np.pi
def convertLoc(longiVal, latiVal):
longiVal = longiVal/180.0*np.pi
latiVal = latiVal/180.0*np.pi
x = np.arcsin(np.sin((longiVal-flmLongi)/2.0)*np.cos(flmLati))*R*2
y = (latiVal-flmLati)*R
return [x, y]
cAllX = []
cAllY = []
for i in range(len(cAllSite)):
[x, y] = convertLoc(cAllLongi[i], cAllLati[i])
cAllX.append(x)
cAllY.append(y)
#------------------------------------------------------------------------------
#--------------------FALMA波形データの保存場所を特定する関数----------
dirFile = '/media/lightning/HDD0/list/FALMA_dirlist.txt'
endDateMat = []
diskMat = []
fid = open(dirFile)
while True:
strLine = fid.readline()
if len(strLine)<2:
break
endDateMat.append(strLine[0:8])
diskMat.append(strLine[9:-1])
fid.close()
def getDisk(strDate):
count = sum(1 for d in endDateMat if d < strDate)
return diskMat[count]
#----------------------------------------------------------------------
#Read DALMA data
tMat = []
xMat = []
yMat = []
zMat = []
fidLoc = open('/media/lightning/HDD0/results/'+strDate[0:4]+'/3DLocRes/'+strDate+'/HF3D_'+strTime+'.dat')
fidLoc.readline()
while True:
strLine = fidLoc.readline()
if len(strLine)<2:
break
tVal = float(strLine[0:10])
if tVal<begTime:
continue
elif tVal>endTime:
break
xVal = float(strLine[11:18])/1000
yVal = float(strLine[19:26])/1000
zVal = float(strLine[27:32])/1000
tMat.append(tVal)
xMat.append(xVal)
yMat.append(yVal)
zMat.append(zVal)
fidLoc.close()
#これらの放電と指定したサイトの距離を計算する
#同じ距離と仮定し、xMat,yMatの中央値を使って計算する
x0 = np.median(xMat)
y0 = np.median(yMat)
siteIndex = cAllSite.index(siteName)
siteX = cAllX[siteIndex]
siteY = cAllY[siteIndex]
siteDis = ((siteX-x0)**2+(siteY-y0)**2)**0.5
pDiffer = siteDis*10/3
#FALMA波形データを読み込む
strDisk = getDisk(strDate)
dataDir = '/media/lightning/'+strDisk+strDate+'/'+siteName+'/'
dataFile = siteName+'L'+strTime+'.bz2'
fidFile = bz2.BZ2File(dataDir+dataFile)
dataMat = np.frombuffer(fidFile.read(), np.int16)
fidFile.close()
begIndex = int(round(begTime*1000+pDiffer))
endIndex = int(round(endTime*1000+pDiffer))
waveTMat = np.linspace(begTime, endTime, endIndex-begIndex)
#Make figure
le = 0.12
re = 0.04
w = 1-le-re
te = 0.05
be = 0.1
h = (1-te-be)/2
f = plt.figure(figsize=(8, 6))
ax1 = f.add_axes([le, be+h, w, h])
ax2 = f.add_axes([le, be, w, h])
ax1.set_xticks([])
ax1.scatter(tMat, zMat, marker='o', c=tMat, s=20, edgecolor='none', cmap='jet')
ax2.plot(waveTMat, dataMat[begIndex:endIndex])
ax2.text(0.98, 0.98, siteName, horizontalalignment='right', verticalalignment='top', transform = ax2.transAxes)
ax2.text(0.02, 0.98, 'd=%5.1f km' % siteDis, horizontalalignment='left', verticalalignment='top', transform = ax2.transAxes)
ax1.set_ylabel('Height (km)')
ax2.set_xlabel('Time (ms, after '+strNatTime+' JST)')
ax2.set_ylabel('E change (Digital Unit)')
ax1.set_xlim([begTime, endTime])
ax2.set_xlim([begTime, endTime])
plt.savefig(picDir+strTime+'_'+siteName+'.png', dpi=200)行93,94に距離と時間差(波形の点差)を計算し、その時間差を考慮して、行104,105に波形の対応の部分を特定する。そして、行106に共通の時間軸を作る。
3. 1秒間の全体像を作る
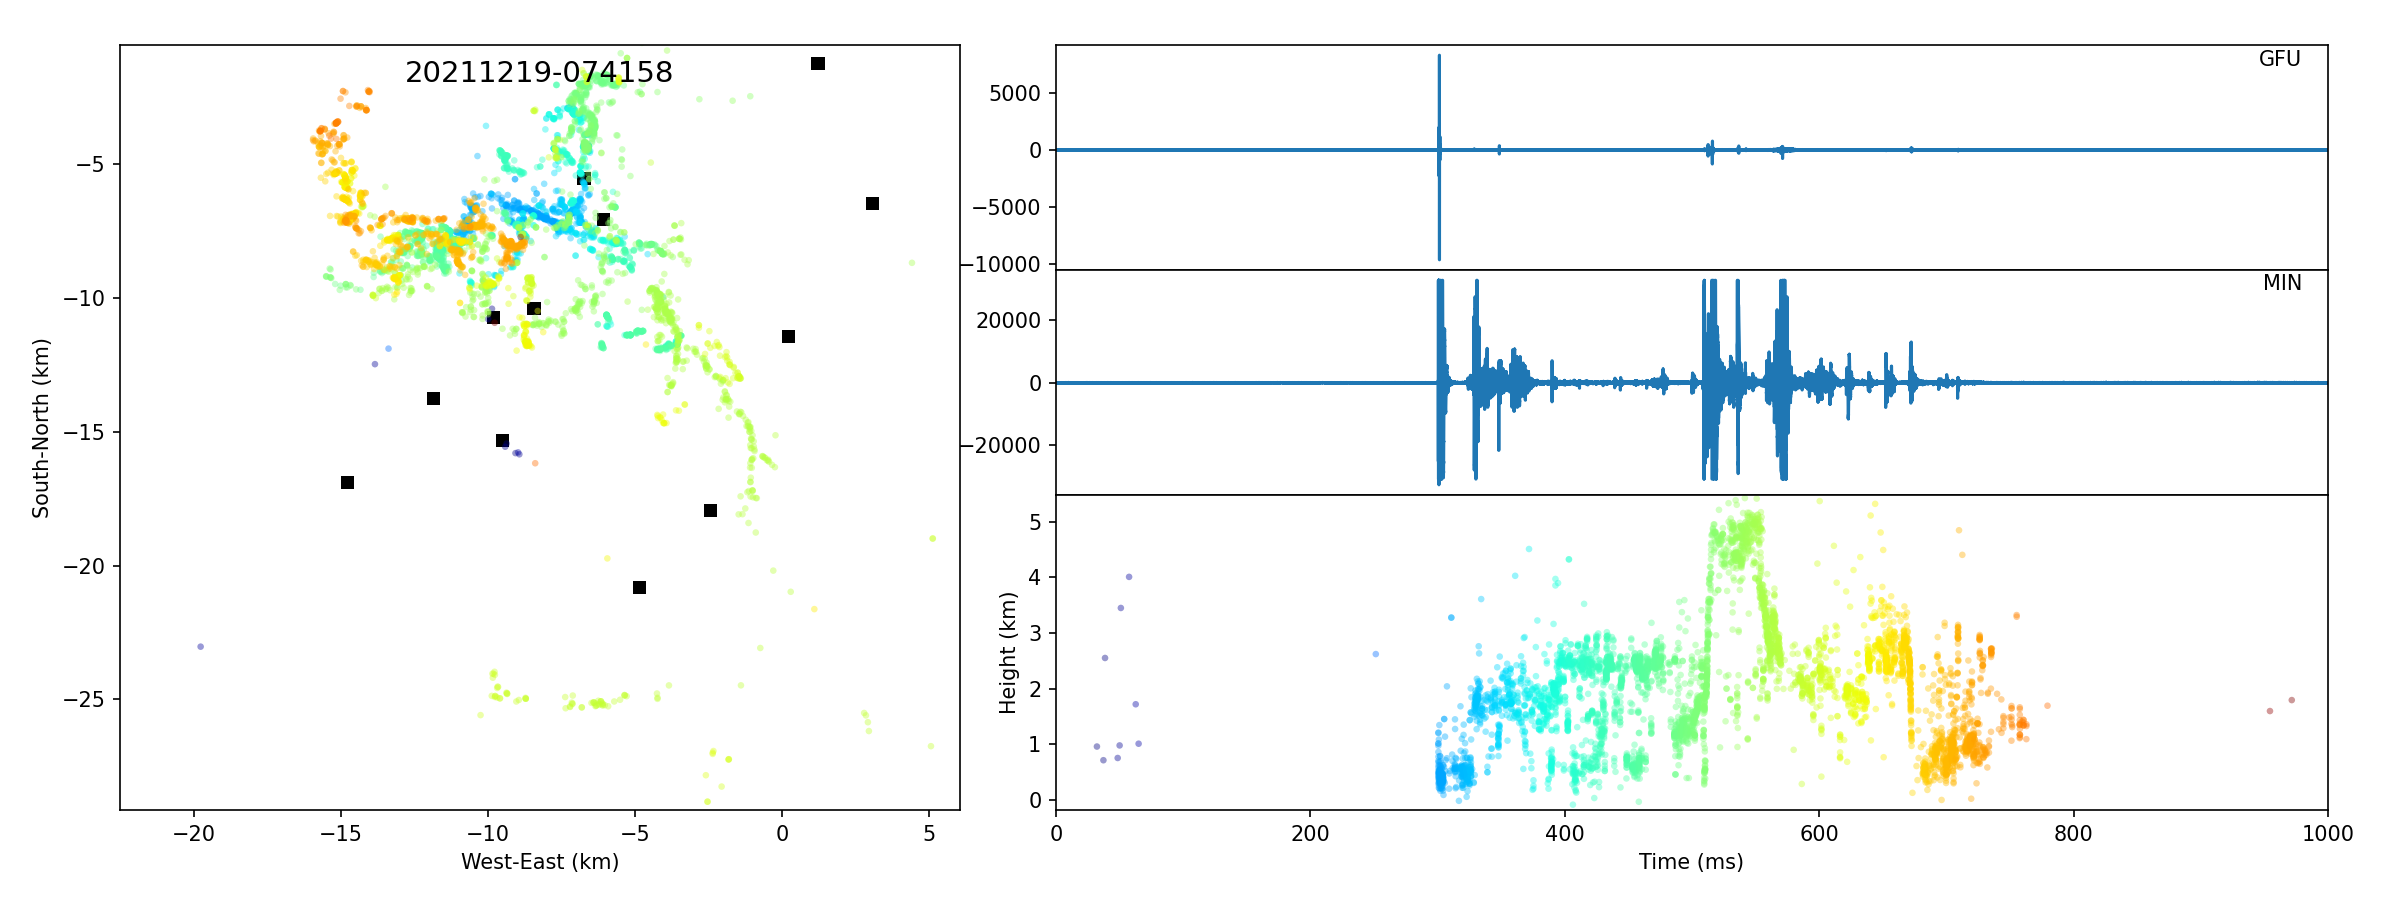
詳しく解析する前に、雷の全体像を把握することが必要です。そのために、1秒間ごとのDALMA標定結果とFALMA波形両方を示す図を作る必要があります。
以下のような図を作成します。左側はDALMA標定結果の平面図、右側はFALMAの2サイトの波形と標定結果の高度ー時間図です。この図で全体の構造を把握した上で、更に詳しく解析したい放電を特定します。ここは標定結果と波形の時間差を考慮しないです。
以下はこの図を作成するコードです。設定する箇所:
行9:10桁のunix time
行10:図の保存場所
#!/usr/bin/env python3

import os
import bz2
import datetime
import numpy as np
import matplotlib.pyplot as plt

strTime = '1639867318'
picDir = '/home/username/'


strNatTime = datetime.datetime.fromtimestamp(float(strTime)).strftime('%Y%m%d-%H%M%S')
strDate = strNatTime[0:8]

#Use two of the sites for waveform plot
backSiteMat = ['GFU', 'MIN', 'NZN', 'AKK', 'FTK', 'NAT', 'NNO']

#----------------------DALMAサイトの緯度経度をX,Yに変換する------------------------
cAllSite = [         'HND',     'ITF',     'KID',     'KZK',     'MIN',     'MIY',     'OUR',     'RGJ',     'SMD',     'STN',     'TDD',     'WIM',     'YHD']
cAllLati = [ 36.657167, 36.696467, 36.748833, 36.608067, 36.666450, 36.598733, 36.622067,  36.77815, 36.710183, 36.701867, 36.636133, 36.663500, 36.572667]
cAllLongi= [136.762517,136.691867,136.773633,   136.594,136.665183,  136.7327,136.653083,136.807017,136.684317,136.794433,136.626717,136.649650,  136.7056]

R = 6370.519
flmLati = 36.76/180*np.pi
flmLongi = 136.76/180*np.pi
def convertLoc(longiVal, latiVal):
    longiVal = longiVal/180.0*np.pi
    latiVal = latiVal/180.0*np.pi
    x = np.arcsin(np.sin((longiVal-flmLongi)/2.0)*np.cos(flmLati))*R*2
    y = (latiVal-flmLati)*R
    return [x, y]

cAllX = []
cAllY = []
for i in range(len(cAllLati)):
    [siteX, siteY] = convertLoc(cAllLongi[i], cAllLati[i])
    cAllX.append(siteX)
    cAllY.append(siteY)
#------------------------------------------------------------------------------

#--------------------FALMA波形データの保存場所を特定する関数----------
dirFile = '/media/lightning/HDD0/list/FALMA_dirlist.txt'
endDateMat = []
diskMat = []
fid = open(dirFile)
while True:
    strLine = fid.readline()
    if len(strLine)<2:
        break
    endDateMat.append(strLine[0:8])
    diskMat.append(strLine[9:-1])
fid.close()

def getDisk(strDate):
    count = sum(1 for d in endDateMat if d < strDate)
    return diskMat[count]
#----------------------------------------------------------------------

#Read DALMA data
tMat = []
xMat = []
yMat = []
zMat = []
fidLoc = open('/media/lightning/HDD0/results/'+strDate[0:4]+'/3DLocRes/'+strDate+'/HF3D_'+strTime+'.dat')
fidLoc.readline()
while True:
    strLine = fidLoc.readline()
    if len(strLine)<2:
        break
    tVal = float(strLine[0:10])
    xVal = float(strLine[11:18])/1000
    yVal = float(strLine[19:26])/1000
    zVal = float(strLine[27:32])/1000
    tMat.append(tVal)
    xMat.append(xVal)
    yMat.append(yVal)
    zMat.append(zVal)
fidLoc.close()

#Read FALMA data
strDisk = getDisk(strDate)
dataRoot = '/media/lightning/'+strDisk+strDate+'/'
dataMatList = []
plotSiteMat = []
siteDisMat = []
for siteName in backSiteMat:
    dataFile = dataRoot+siteName+'/'+siteName+'L'+strTime+'.bz2'
    if os.path.exists(dataFile)==False:
        continue
    fidFile = bz2.BZ2File(dataFile)
    dataMat = np.frombuffer(fidFile.read(), np.int16)
    fidFile.close()
    dataMatList.append(dataMat)
    plotSiteMat.append(siteName)
    if len(plotSiteMat)>=2:
        break
waveTMat = np.linspace(0, 1000, 1000000)

#Make figure
f = plt.figure(figsize=(16,6))

le = 0.05
re = 0.03
hb = 0.04
w1 = 0.35
w2 = 1-hb-le-re-w1

te = 0.05
be = 0.1
h1 = 0.25
h2 = 1-te-be-h1*2

ax1 = f.add_axes([le, be, w1, h1*2+h2])
ax2 = f.add_axes([le+w1+hb, be+h1+h2, w2, h1])
ax3 = f.add_axes([le+w1+hb, be+h2, w2, h1])
ax4 = f.add_axes([le+w1+hb, be, w2, h2])
ax2.set_xticks([])
ax3.set_xticks([])

#地図を加える(https://tingwu.info/pylab/lab03.html)
# mapData = '/home/username/japanmapXY.npy' #ダウンロードした地図データの保存先
# mapMat = np.load(mapData)
# ax1.plot(mapMat[:, 0], mapMat[:, 1], c='k', lw=0.5)

#平面図
ax1.scatter(cAllX, cAllY, s=40, marker='s', facecolor='k', edgecolor='none')
ax1.scatter(xMat, yMat, s=10, c=tMat, edgecolor='none', cmap='jet', alpha=0.4)
#X軸とY軸を制限し、同じ長さにする
xMat.sort()
xUpper = xMat[int(len(xMat)*0.99)]
xLower = xMat[int(len(xMat)*0.01)]
xlimRange = xUpper-xLower
xCenter = (xUpper+xLower)/2
yMat.sort()
yUpper = yMat[int(len(yMat)*0.99)]
yLower = yMat[int(len(yMat)*0.01)]
ylimRange = yUpper-yLower
yCenter = (yUpper+yLower)/2
if xlimRange>ylimRange:
    axisHalfLen = xlimRange/2*1.1
else:
    axisHalfLen = ylimRange/2*1.1
ax1.set_xlim([xCenter-axisHalfLen, xCenter+axisHalfLen])
ax1.set_ylim([yCenter-axisHalfLen, yCenter+axisHalfLen])

#高度ー時間図
ax4.scatter(tMat, zMat, s=10, c=tMat, edgecolor='none', cmap='jet', alpha=0.4)
#高さ表示の範囲を調整する(非常に高いと低いノイズ点を除外)
zMat.sort()
zUpper = zMat[int(len(zMat)*0.99)]
zLower = zMat[int(len(zMat)*0.01)]
zLen = zUpper-zLower
zMin = zLower-zLen*0.1
zMax = zUpper+zLen*0.1
ax4.set_ylim([zMin, zMax])

#波形図
ax2.plot(waveTMat, dataMatList[0])
ax2.text(0.98, 0.98, plotSiteMat[0], horizontalalignment='right', verticalalignment='top', transform = ax2.transAxes)
ax3.plot(waveTMat, dataMatList[1])
ax3.text(0.98, 0.98, plotSiteMat[1], horizontalalignment='right', verticalalignment='top', transform = ax3.transAxes)

ax1.text(0.5, 0.98, strNatTime, fontsize=14, horizontalalignment='center', verticalalignment='top', transform = ax1.transAxes)
ax1.set_xlabel('West-East (km)')
ax1.set_ylabel('South-North (km)')
ax4.set_ylabel('Height (km)')
ax4.set_xlabel('Time (ms)')
ax2.set_xlim([0, 1000])
ax3.set_xlim([0, 1000])
ax4.set_xlim([0, 1000])

plt.savefig(picDir+strTime+'_3DWave.png', dpi=150)
#!/usr/bin/env python3
import os
import bz2
import datetime
import numpy as np
import matplotlib.pyplot as plt
strTime = '1639867318'
picDir = '/home/username/'
strNatTime = datetime.datetime.fromtimestamp(float(strTime)).strftime('%Y%m%d-%H%M%S')
strDate = strNatTime[0:8]
#Use two of the sites for waveform plot
backSiteMat = ['GFU', 'MIN', 'NZN', 'AKK', 'FTK', 'NAT', 'NNO']
#----------------------DALMAサイトの緯度経度をX,Yに変換する------------------------
cAllSite = [ 'HND', 'ITF', 'KID', 'KZK', 'MIN', 'MIY', 'OUR', 'RGJ', 'SMD', 'STN', 'TDD', 'WIM', 'YHD']
cAllLati = [ 36.657167, 36.696467, 36.748833, 36.608067, 36.666450, 36.598733, 36.622067, 36.77815, 36.710183, 36.701867, 36.636133, 36.663500, 36.572667]
cAllLongi= [136.762517,136.691867,136.773633, 136.594,136.665183, 136.7327,136.653083,136.807017,136.684317,136.794433,136.626717,136.649650, 136.7056]
R = 6370.519
flmLati = 36.76/180*np.pi
flmLongi = 136.76/180*np.pi
def convertLoc(longiVal, latiVal):
longiVal = longiVal/180.0*np.pi
latiVal = latiVal/180.0*np.pi
x = np.arcsin(np.sin((longiVal-flmLongi)/2.0)*np.cos(flmLati))*R*2
y = (latiVal-flmLati)*R
return [x, y]
cAllX = []
cAllY = []
for i in range(len(cAllLati)):
[siteX, siteY] = convertLoc(cAllLongi[i], cAllLati[i])
cAllX.append(siteX)
cAllY.append(siteY)
#------------------------------------------------------------------------------
#--------------------FALMA波形データの保存場所を特定する関数----------
dirFile = '/media/lightning/HDD0/list/FALMA_dirlist.txt'
endDateMat = []
diskMat = []
fid = open(dirFile)
while True:
strLine = fid.readline()
if len(strLine)<2:
break
endDateMat.append(strLine[0:8])
diskMat.append(strLine[9:-1])
fid.close()
def getDisk(strDate):
count = sum(1 for d in endDateMat if d < strDate)
return diskMat[count]
#----------------------------------------------------------------------
#Read DALMA data
tMat = []
xMat = []
yMat = []
zMat = []
fidLoc = open('/media/lightning/HDD0/results/'+strDate[0:4]+'/3DLocRes/'+strDate+'/HF3D_'+strTime+'.dat')
fidLoc.readline()
while True:
strLine = fidLoc.readline()
if len(strLine)<2:
break
tVal = float(strLine[0:10])
xVal = float(strLine[11:18])/1000
yVal = float(strLine[19:26])/1000
zVal = float(strLine[27:32])/1000
tMat.append(tVal)
xMat.append(xVal)
yMat.append(yVal)
zMat.append(zVal)
fidLoc.close()
#Read FALMA data
strDisk = getDisk(strDate)
dataRoot = '/media/lightning/'+strDisk+strDate+'/'
dataMatList = []
plotSiteMat = []
siteDisMat = []
for siteName in backSiteMat:
dataFile = dataRoot+siteName+'/'+siteName+'L'+strTime+'.bz2'
if os.path.exists(dataFile)==False:
continue
fidFile = bz2.BZ2File(dataFile)
dataMat = np.frombuffer(fidFile.read(), np.int16)
fidFile.close()
dataMatList.append(dataMat)
plotSiteMat.append(siteName)
if len(plotSiteMat)>=2:
break
waveTMat = np.linspace(0, 1000, 1000000)
#Make figure
f = plt.figure(figsize=(16,6))
le = 0.05
re = 0.03
hb = 0.04
w1 = 0.35
w2 = 1-hb-le-re-w1
te = 0.05
be = 0.1
h1 = 0.25
h2 = 1-te-be-h1*2
ax1 = f.add_axes([le, be, w1, h1*2+h2])
ax2 = f.add_axes([le+w1+hb, be+h1+h2, w2, h1])
ax3 = f.add_axes([le+w1+hb, be+h2, w2, h1])
ax4 = f.add_axes([le+w1+hb, be, w2, h2])
ax2.set_xticks([])
ax3.set_xticks([])
#地図を加える(https://tingwu.info/pylab/lab03.html)
# mapData = '/home/username/japanmapXY.npy' #ダウンロードした地図データの保存先
# mapMat = np.load(mapData)
# ax1.plot(mapMat[:, 0], mapMat[:, 1], c='k', lw=0.5)
#平面図
ax1.scatter(cAllX, cAllY, s=40, marker='s', facecolor='k', edgecolor='none')
ax1.scatter(xMat, yMat, s=10, c=tMat, edgecolor='none', cmap='jet', alpha=0.4)
#X軸とY軸を制限し、同じ長さにする
xMat.sort()
xUpper = xMat[int(len(xMat)*0.99)]
xLower = xMat[int(len(xMat)*0.01)]
xlimRange = xUpper-xLower
xCenter = (xUpper+xLower)/2
yMat.sort()
yUpper = yMat[int(len(yMat)*0.99)]
yLower = yMat[int(len(yMat)*0.01)]
ylimRange = yUpper-yLower
yCenter = (yUpper+yLower)/2
if xlimRange>ylimRange:
axisHalfLen = xlimRange/2*1.1
else:
axisHalfLen = ylimRange/2*1.1
ax1.set_xlim([xCenter-axisHalfLen, xCenter+axisHalfLen])
ax1.set_ylim([yCenter-axisHalfLen, yCenter+axisHalfLen])
#高度ー時間図
ax4.scatter(tMat, zMat, s=10, c=tMat, edgecolor='none', cmap='jet', alpha=0.4)
#高さ表示の範囲を調整する(非常に高いと低いノイズ点を除外)
zMat.sort()
zUpper = zMat[int(len(zMat)*0.99)]
zLower = zMat[int(len(zMat)*0.01)]
zLen = zUpper-zLower
zMin = zLower-zLen*0.1
zMax = zUpper+zLen*0.1
ax4.set_ylim([zMin, zMax])
#波形図
ax2.plot(waveTMat, dataMatList[0])
ax2.text(0.98, 0.98, plotSiteMat[0], horizontalalignment='right', verticalalignment='top', transform = ax2.transAxes)
ax3.plot(waveTMat, dataMatList[1])
ax3.text(0.98, 0.98, plotSiteMat[1], horizontalalignment='right', verticalalignment='top', transform = ax3.transAxes)
ax1.text(0.5, 0.98, strNatTime, fontsize=14, horizontalalignment='center', verticalalignment='top', transform = ax1.transAxes)
ax1.set_xlabel('West-East (km)')
ax1.set_ylabel('South-North (km)')
ax4.set_ylabel('Height (km)')
ax4.set_xlabel('Time (ms)')
ax2.set_xlim([0, 1000])
ax3.set_xlim([0, 1000])
ax4.set_xlim([0, 1000])
plt.savefig(picDir+strTime+'_3DWave.png', dpi=150)Back to Python関連資料